
What is the average response rate for online surveys? Excellent question! Both we in Startquestion and our customers are asking it ourselves and there is a reason why. When you conduct an online survey it’s obvious you would like to get as many completions as you can. Or at least as many as you need. If you are starting your adventure with an online survey you can think that sky’s the limit and aim in… 100% response rate. Well, you will see that after gathering some results your expectations will have to meet reality. Trust us, we are online survey experts and we have some experience in that.
So what is the response rate you should expect? What is a high survey response rate? What number we, the researchers, should aim to? We prepared this article to help you find out, so… let’s begin our journey!
33% is reported to be the average survey response rate when it comes to short answers while for long answers, the number is further reduced. There exists no established threshold for an appropriate response rate so it mainly relies upon how you create, distribute and collect the data for the survey.
However, over the past few years, several researches have been undertaken pertaining to what should be a survey’s average response rate and which particular factors, next to, for example survey length, exert an impact on it. In this article, we have combined all the available data into an infographic and supported it with the latest data available to aid in the understanding of how to increase survey response rate.
Before jumping towards the numbers, it is fundamental to have a comprehensive understanding of what response rate actually implies.
Create perfect survey on Startquestion
Gather feedback via weblink, social media, email, use ready-made survey templates and achieve high response rate.
No credit card required · Cancel any time · GDRP Compilant
What is meant by a response rate?
The response rate refers to the number of individuals who participate in the survey divided by the number of individuals to whom the survey was originally sent (the sample size, target audience). The answer is then multiplied by 100 so as to express it as a %.
Therefore, basic formula to measure response rate is;
Response Rate = (Number of individuals who participated in the survey / Number of individuals – survey target audience – people to whom the survey was originally sent) x 100
For instance, if a survey is sent out to 200 people, out of which only 70 answered, the response rate will equal to 70/200 x 100 = 35%
It’s quite simple, right? Now, let’s come to why exactly the response rate holds so much importance?
Significance of Response Rates in Surveys
The good survey response rate directly impacts the credibility of the research. If the response rate is low, a sampling bias may emerge. This can be better explained through an example;
For instance,
If your target audience are managers, and you choose a sample size of 500 people from a particular area and inquire regarding their workload, there is a probability that managers having intense workload might not find the time required to complete the survey or managers with low levels of workload may simply decline to complete it because of the fear that their managers might see them as having nothing to do. Such type of bias is referred to as a non-response bias and it results in inaccurate results.
The most fundamental indicator of a survey’s quality is its response rate. However, the latest studies conducted in the past have indicated that surveys having lesser response rates of around 20% had greater precise results relative to those with higher survey response rates of 60 or 70%. Despite these studies, surveys having higher response rates are preferred since in that case, the data that is missing is non-random. Surveys having a response rate of 80% or more from a minor random sample is more preferred relative to a survey with a lower response rate from a huge sample size.
Now that our basics are clear, let’s move towards the main crux of the discussion.
What is Average Response Rate
The following chart depicts the average of the response rates for some of the commonly employed survey methods, grounded upon the latest data collected.
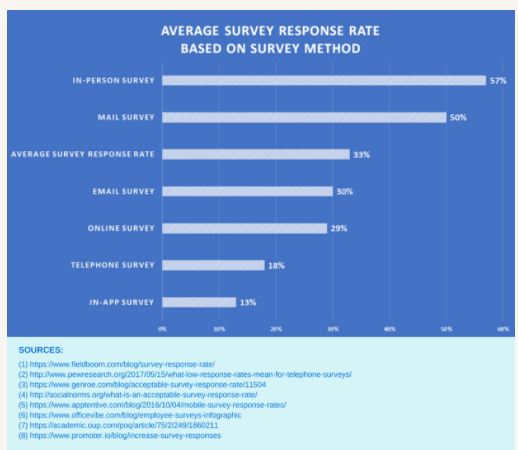
In-person surveys still serve as one of the key effective survey mediums, having a 57% response rate. These surveys can be conducted instantly and offer the most tailored experience, relative to the other methods.
Next in line, comes the mail survey, having a response rate of 50%. Although we are currently residing in a digitalized world with an unprecedented pace of technological advancements, receiving a survey invitation through a real man provides for a more quality experience. However, the drawback of this method is its high cost.
Then comes the e-mail survey that has a 30% average response rate. Since, in today’s world, individuals are bombarded daily with several spam mails, it becomes extremely hard to apply spam filters for surveys.
*A pro-tip to deal with this challenge is to avoid the usage of the word ‘survey’ in the subject lines of the mail. This will enhance the response rate of the survey by 10%. Your survey can also be added to confirmation or post-purchase email which will ensure that the survey is delivered at an appropriate time. In a separate article, you can read more about how to achieve a high survey response rate in email surveys.
Next, on the list is the survey or website. As previously mentioned, it is very challenging to have a precise view pertaining to the survey invitations required to accurately measure the response rate of the survey. On our blog you can find out more about how to achieve a high survey response rates in website surveys.
The second last on the list is the phone survey. The past two decades have witnessed a massive decline in the response rate for telephone surveys and the same trend is likely to continue in the future too. However, the studies conducted have depicted that although telephone surveys have low response rates, their accuracy levels remain high.
Finally, the last one of the lists is the in-app survey. These are a relatively new type of method and not much research has been done on this topic yet. Just like the case with online surveys, this method is also challenging in terms of getting a precise definition to who has been requested to participate in the survey research and who has been not.
If all of this data is accumulated into one figure, the consequent average survey response rate equals to 33%.
Additional Takeaways
- Surveys that are conducted internally (survey for employees, HR surveys) have a relatively higher survey response rate (20%) as compared to the ones conducted externally (survey for customers / user experience survey).
- The survey response rate is directly correlated to the time-frame of the survey. Studies have shown that surveys with more than 12 questions or a duration of over 5 minutes experiences a 17% decline in the response rate.
- If a questionnaire comes with the reminder to complete the survey within a time span of 3 days to a week post the invitation has been sent enhances the response rate with up to 14%. You might be worried that people might end up getting annoyed with such a reminder but we have found that in reality, merely 0.5% will unsubscribe which is insignificant.
- The business-to-consumer (B2B) response rate is on average 12% lower than that of the business-to-business (B2B) response rate.
Major Elements that Affect Response Rates
There are 5 core factors that directly impact the response rate of surveys and must be taken into account in order to increase the survey response rates:
- The Purpose of the Survey
Before initiating any survey, it is important to know and understand what the survey aims to achieve. It is fundamental to have clear goals established in your mind. When your vision is clear, it will eventually become way easier to persuade people in taking your survey. Using cliched opening statements such as ‘Can you spare some time for a quick survey’ will reduce the survey response rate with 11% relative to using an engaging introductory statement such as ‘In an attempt to enhance our customer service, we would like to know your valuable opinion and so would like to ask 5 quick questions.’
- The Experience offered by the Survey
It is extremely important for the survey to be viewed as appealing and attractive to the targeted audience, in terms of style as well as language. It is a must for you to ensure that everything is user-friendly, understandable, and in simple language. There are several survey-makers in the market that provide prepared survey templates that are ready to be used instantly. Startquestion is one of them. Using those will save your time and effort since you would not have to begin from the very start.
In the case of online surveys, it is fundamental to make the survey receptive and restrict the number of clicks that are required for the completion of the survey.
It is always a good idea to customize the survey and add a little bit of personalization. A study conducted in 2005 by Dirk Heerwegh found that questionnaires with personalized invites to complete the survey (for instance, Dear Jane instead of Dear Sir or Madame) had enhanced response rates by 7.8%. Moreover, users receiving such invites were 2.6% less probable to drop out before the completion of the entire survey.
As previously mentioned, language is an extremely important factor. You must understand the mentality of your targeted audience and then design your questions upon those findings. You must never rely on a single question type, rather employ a combination of survey question types such as matrix questions, Likert scale, and so on. This is important because each of these types has its own distinct strengths.
- The length/duration of the Survey
A short survey is always better. Distraction rates are very high in surveys which is why you must only ask the questions that are required. A single meaningless question will drift away the attention of the person.
Like previously discussed, a survey that has over 12 questions and takes more than 5 minutes to finish witnesses a 15% decrease in the response rate. This decrease is further amplified (up to 40%) when the duration of the survey exceeds 10 minutes.
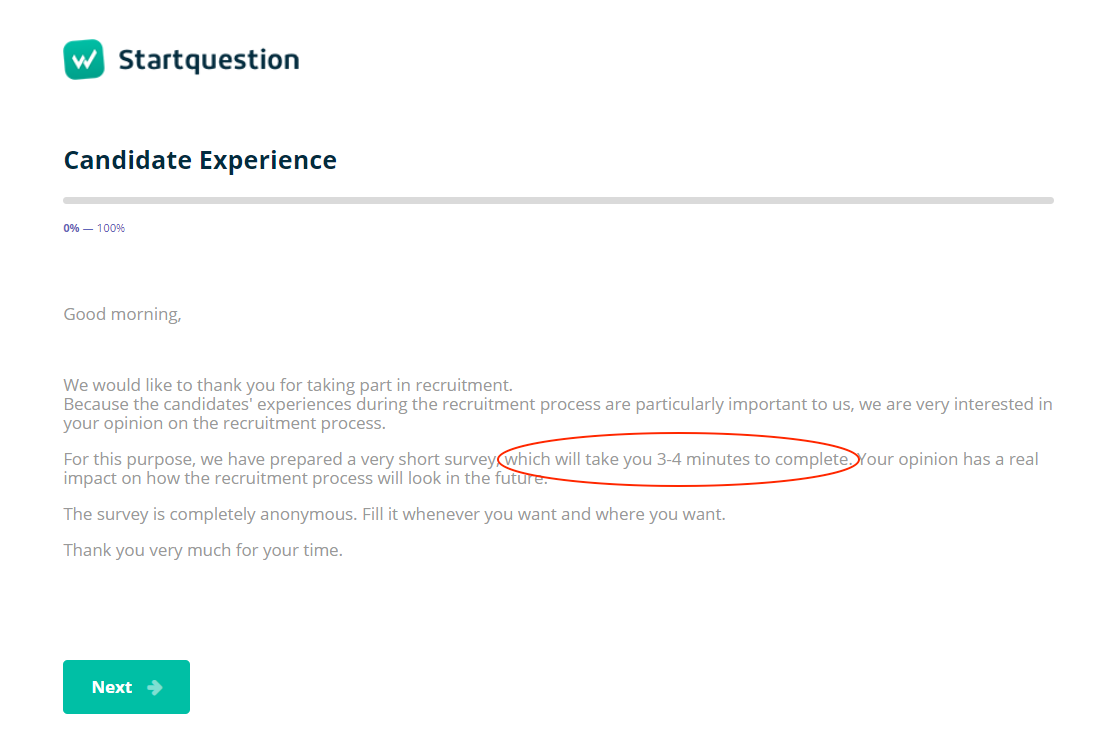
You must inform your respondents regarding the duration of the survey before it is initiated. You should also ensure that the timeframe is strictly followed. A good introduction to the survey can look like this:
- Targeted audience of the Survey
When designing the survey, it is important to take into consideration the targeted audience. A common error often witnessed is sending the same survey to different segments of the audience and then expecting similar response rates.
When targeting a B2C audience, the expectation is a surveys response rate that is 12% lower than that of a B2B audience. Likewise, internal surveys will result in a 20% more response rate relative to the external surveys.
- Incentives offered by the Survey
People do not like doing things for free. They require some sort of incentive or motivation that can urge them to keep going. Studies conducted depict that when incentives are attached to the questionnaire, this enhances the survey response rate by 10-15%, depending upon the appealing nature and quality of the incentive to the targeted audience.
The majority of the research experts agree upon the fact that useful as well as appropriate information is the most effective incentive that can be offered to business audiences. For instance, the information provided by them will result in improvements of particular dimensions of your products and services which will, in turn, result in an improved overall experience for the customers. This is referred to as an intrinsic reward.
It is a wise thing to emphasize upon informing the respondents regarding the intrinsic rewards attached with the survey as the respondents will then understand that it is in the best interest to participate and finish the survey with full honesty.
Another option in this regard can be to provide extrinsic rewards like coupons, special deals, discount vouchers, and codes to the customers who complete the survey. One of the core time-tested strategies for getting survey results is that of coupon promotion. Such promotions attract customers and they have a higher probability to finish the survey. However, there is a drawback to this method as some people might only complete the survey in the urge of the reward. Individuals with such a mindset might not answer the questions honestly or take the process in seriousness which will result in the generation of invalid responses.
Such issues can be prevented by giving an incentive, which is although nature-wise extrinsic, not of any major value.
The above statement is reinforced by research undertaken by e-Rewards Market Research whereby two random sample selections were employed. A total of 4000 individuals were requested to participate in the survey for entry into a drawing of $2500. Another set of 4000 individuals was requested to participate in the survey and complete it for $2 in cash. Each of the groups was initiated and closed on the same day and time. The survey had a duration of 1 minute and the topic was linked with music and books.
The results: Within a week of sending the invitation, the response rates were as follows:
- For $2 cash, the response rates were 19.3%.
- For $2500 sweepstake sample, response rates were 12.2%
These numbers clearly indicate that individuals are more likely to complete surveys when they are assured that they will be receiving something in return rather than a slight probability of winning a huge prize.
Use ready-made survey templates and achieve high response rate
Comments on Response Rate
When it comes to face-to-face or phone surveys, it is quite simple to define the participants of the survey, i.e. how many individuals have been invited to participate in the survey?
However, for email surveys, things are not that straightforward.
Do you count every email that you send? Does that also include bounced emails? Do you only count the ones that got opened? It depends upon which one you choose but this can massively inflate the response rate.
For surveys on websites (website survey), it becomes even more challenging.
It is extremely hard to define the number of invitations for a particular survey that has been embedded on a webpage. This is because the visitor on-page will be exposed to the survey, however in technical terms, he is not invited. Hence, if you count all the visitors of the page as participants, this can result in a very low response rate.
So how should you go about it?
The wisest way to deal with this is to compute the completion rate of the survey rather than the response rate.
What is meant by a survey completion rate?
The completion rate of a particular survey is measured by dividing the number of surveys that have been filled by the number of surveys initiated by the participants. Therefore, in this measure, only the particular participants who entered and finished the survey are incorporated.
How is the completion rate calculated?
For instance, if 200 individuals begin the survey, and 100 of them complete it till the end, the completion rate, in this case, would equal to (100/200) x 100 = 50%
This serves as a more appropriate indicator for assessing the performance of the survey, specifically in the case of web and online surveys.
Comparison of Response Rates & Completion Rates
Response rate implies the quantity of individuals within a particular sample pool who replied to a survey whereas the completion rate refers to the quantity of individuals who finished the survey out of the total quantity of individuals who responded to the survey. Basically, the complete rate implies only the individuals who interacted with the survey.
To sum up – how to create surveys with a high response rate?
Response rate is an indicator used to assess the performance of a survey. However, it is important to note that average response rates can vary from country to country and industry to industry.
The most effective benchmark that can be established in this regard is yourself. By employing the response rates and historical data from past surveys, you can use them as key indicators to figure out whether any modification or enhancements are required.
Remember that using Startquestion to conduct employee, user, and customer research you can use ready-to-use survey templates and create the survey even in a few minutes. You can try all the features Startquestion guarantee during a free trial – try it out now, without any credit card or subscription.
And if you wonder how to avoid mistakes while conducting the survey, and how to achieve good surveys response rates, feel free to visit other articles in our blog and User Guide.